KubernatesでPrometheusとGrafanaとpushgatewayを構築する
Kubernates 環境で Prometheus と Grafana と pushgateway の構築を素振りしたので備忘録として残します。
リポジトリは以下
やりたいこと
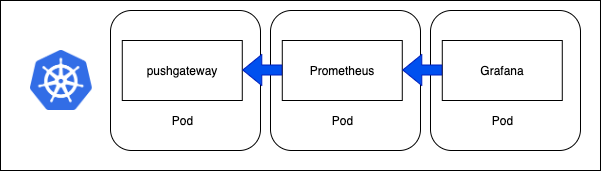
- Prometheus と Grafana と pushgateway を Kubernates で管理する
- Grafana は Prometheus をデータソースとして参照する
- Prometheus は pushgateway からメトリクスをpullする
とりあえずは、ローカルマシン上での構築を目指します。構成としては以下の通りです。
環境情報
- Mac OS X
11.1 - Docker Desktop
3.0.0- Docker
20.1.0 - Kubernates
1.19.3
- Docker
構築手順
今回の手順は Prometheus+GrafanaでKubernetesクラスターを監視する ~Binaryファイルから起動+yamlファイルから構築~ を参考にさせていただきつつ、個人的に欲しい部分を拡張しています。
Kubernates Contextを指定する
任意のコンテキストで構いませんが今回は docker-desktop を指定します。
1kubectl config use-context docker-desktopまた、今回のnamespaceを monitoring にしておきます。
1kubectl create namespace monitoringClusterRoleとClusterRoleBindingの作成
まずは ClusterRole と ClusterRoleBinding を作成します。 Role と RoleBinding に変更して使ってもらっても構いません。
 1apiVersion: rbac.authorization.k8s.io/v1
 2kind: ClusterRole
 3metadata:
 4  name: prometheus
 5rules:
 6- apiGroups: [""]
 7  resources:
 8  - nodes
 9  - nodes/proxy
10  - services
11  - endpoints
12  - pods
13  verbs: ["get", "list", "watch"]
14- apiGroups:
15  - extensions
16  resources:
17  - ingresses
18  verbs: ["get", "list", "watch"]
19- nonResourceURLs: ["/metrics"]
20  verbs: ["get"]
21---
22apiVersion: rbac.authorization.k8s.io/v1
23kind: ClusterRoleBinding
24metadata:
25  name: prometheus
26roleRef:
27  apiGroup: rbac.authorization.k8s.io
28  kind: ClusterRole
29  name: prometheus
30subjects:
31- kind: ServiceAccount
32  name: default
33  namespace: monitoring
pushgatewayを作成する
次に pushgateway の定義を作成します。
ここでは Deployment と Service を作成しています。
以下の設定では、 別のPodからは pushgateway-service:8120 で pushgateway にアクセスできるようになります。
 1apiVersion: apps/v1
 2kind: Deployment
 3metadata:
 4  name: pushgateway-deployment
 5  namespace: monitoring
 6  labels:
 7    app: pushgateway-server
 8spec:
 9  replicas: 1
10  selector:
11    matchLabels:
12      app: pushgateway-server
13  template:
14    metadata:
15      labels:
16        app: pushgateway-server
17    spec:
18      containers:
19        - name: pushgateway
20          image: prom/pushgateway:latest
21          ports:
22            - containerPort: 9091
23---
24apiVersion: v1
25kind: Service
26metadata:
27  name: pushgateway-service
28spec:
29  selector:
30    app: pushgateway-server
31  type: NodePort
32  ports:
33    - port: 8120
34      targetPort: 9091
35      nodePort: 30040
Prometheusを作成する
次に Prometheus の定義を作成します。ここでは Deployment と Service 以外にも ConfigMap を作成します。
Prometheusの設定ファイル(prometheus.yml)をConfigMapに定義してマウントさせることで設定を外出しします。
また、別のPodからは prometheus-service:8080 で Prometheus にアクセスできるようになります。
 1apiVersion: v1
 2kind: ConfigMap
 3metadata:
 4  name: prometheus-server-conf
 5  labels:
 6    name: prometheus-server-conf
 7  namespace: monitoring
 8data:
 9  prometheus.yml: |-
10    # my global config
11    global:
12      scrape_interval:     15s # Set the scrape interval to every 15 seconds. Default is every 1 minute.
13      evaluation_interval: 15s # Evaluate rules every 15 seconds. The default is every 1 minute.
14      # scrape_timeout is set to the global default (10s).
15    # Alertmanager configuration
16    alerting:
17      alertmanagers:
18      - static_configs:
19        - targets:
20          # - alertmanager:9093
21    # Load rules once and periodically evaluate them according to the global 'evaluation_interval'.
22    rule_files:
23      # - "first_rules.yml"
24      # - "second_rules.yml"
25    # A scrape configuration containing exactly one endpoint to scrape:
26    # Here it's Prometheus itself.
27    scrape_configs:
28      # The job name is added as a label `job=<job_name>` to any timeseries scraped from this config.
29      - job_name: 'prometheus'
30        static_configs:
31        - targets: ['localhost:9090']
32
33      - job_name: 'pushgateway'
34        honor_labels: true
35        metrics_path: /metrics
36        static_configs:
37        - targets: ['pushgateway-service:8120']
38---
39apiVersion: apps/v1
40kind: Deployment
41metadata:
42  name: prometheus-deployment
43  namespace: monitoring
44  labels:
45    app: prometheus-server
46spec:
47  replicas: 1
48  selector:
49    matchLabels:
50      app: prometheus-server
51  template:
52    metadata:
53      labels:
54        app: prometheus-server
55    spec:
56      containers:
57        - name: prometheus
58          image: prom/prometheus:latest
59          args:
60            - "--config.file=/etc/config/prometheus.yml"
61            - "--storage.tsdb.path=/prometheus/"
62            - "--storage.tsdb.retention=3d"
63          ports:
64            - containerPort: 9090
65          volumeMounts:
66            - name: config-vol
67              mountPath: /etc/config
68      volumes:
69        - name: config-vol
70          configMap:
71            name: prometheus-server-conf
72---
73apiVersion: v1
74kind: Service
75metadata:
76  name: prometheus-service
77spec:
78  selector:
79    app: prometheus-server
80  type: NodePort
81  ports:
82    - port: 8080
83      targetPort: 9090
84      nodePort: 30000
Grafanaを作成する
次に Grafana の定義を作成します。ここでは Deployment と Service と ConfigMap を作成します。
定義ファイルが少し長くなってしまっていますが、ここでも同様に設定ファイルをConfigMapで作成しています。作成している定義ファイルは データソースの定義 と ダッシュボードの定義 と ダッシュボードの設定 の3種類です。
ダッシュボードの設定については、設定ファイルから作成すると時間がかかるため、GUIから設定した定義をJSONとして出力して貼り付けると良いでしょう。
  1apiVersion: v1
  2kind: ConfigMap
  3metadata:
  4  name: grafana-datasources-conf
  5  labels:
  6    name: grafana-datasources-conf
  7  namespace: monitoring
  8data:
  9  datasources.yml: |-
 10    apiVersion: 1
 11    datasources:
 12    - name: Prometheus
 13      type: prometheus
 14      access: proxy
 15      orgId: 1
 16      uid: 1
 17      url: http://prometheus-service:8080/
 18      basicAuth: false
 19      editable: true
 20      version: 1
 21      isDefault: true
 22---
 23apiVersion: v1
 24kind: ConfigMap
 25metadata:
 26  name: grafana-dashboards-conf
 27  labels:
 28    name: grafana-dashboards-conf
 29  namespace: monitoring
 30data:
 31  dashboards.yml: |-
 32    apiVersion: 1
 33    providers:
 34    - name: 'hoge'
 35      orgId: 1
 36      folder: ''
 37      type: file
 38      disableDeletion: true
 39      editable: true
 40      options:
 41        path: /var/lib/grafana/dashboards
 42---
 43apiVersion: v1
 44kind: ConfigMap
 45metadata:
 46  name: grafana-dashboards-settings
 47  labels:
 48    name: grafana-dashboards-settings
 49  namespace: monitoring
 50data:
 51  hoge.json: |
 52    {
 53      "annotations": {
 54        "list": [
 55          {
 56            "builtIn": 1,
 57            "datasource": "-- Grafana --",
 58            "enable": true,
 59            "hide": true,
 60            "iconColor": "rgba(0, 211, 255, 1)",
 61            "name": "Annotations & Alerts",
 62            "type": "dashboard"
 63          }
 64        ]
 65      },
 66      "editable": true,
 67      "gnetId": null,
 68      "graphTooltip": 0,
 69      "id": 1,
 70      "links": [],
 71      "panels": [
 72        {
 73          "aliasColors": {},
 74          "bars": false,
 75          "dashLength": 10,
 76          "dashes": false,
 77          "datasource": "Prometheus",
 78          "fieldConfig": {
 79            "defaults": {
 80              "custom": {}
 81            },
 82            "overrides": []
 83          },
 84          "fill": 1,
 85          "fillGradient": 0,
 86          "gridPos": {
 87            "h": 9,
 88            "w": 12,
 89            "x": 0,
 90            "y": 0
 91          },
 92          "hiddenSeries": false,
 93          "id": 2,
 94          "legend": {
 95            "avg": false,
 96            "current": false,
 97            "max": false,
 98            "min": false,
 99            "show": true,
100            "total": false,
101            "values": false
102          },
103          "lines": true,
104          "linewidth": 1,
105          "nullPointMode": "null",
106          "options": {
107            "alertThreshold": true
108          },
109          "percentage": false,
110          "pluginVersion": "7.3.7",
111          "pointradius": 2,
112          "points": false,
113          "renderer": "flot",
114          "seriesOverrides": [],
115          "spaceLength": 10,
116          "stack": false,
117          "steppedLine": false,
118          "targets": [
119            {
120              "expr": "go_gc_duration_seconds",
121              "interval": "",
122              "legendFormat": "",
123              "refId": "A"
124            }
125          ],
126          "thresholds": [],
127          "timeFrom": null,
128          "timeRegions": [],
129          "timeShift": null,
130          "title": "Panel Title",
131          "tooltip": {
132            "shared": true,
133            "sort": 0,
134            "value_type": "individual"
135          },
136          "type": "graph",
137          "xaxis": {
138            "buckets": null,
139            "mode": "time",
140            "name": null,
141            "show": true,
142            "values": []
143          },
144          "yaxes": [
145            {
146              "format": "short",
147              "label": null,
148              "logBase": 1,
149              "max": null,
150              "min": null,
151              "show": true
152            },
153            {
154              "format": "short",
155              "label": null,
156              "logBase": 1,
157              "max": null,
158              "min": null,
159              "show": true
160            }
161          ],
162          "yaxis": {
163            "align": false,
164            "alignLevel": null
165          }
166        }
167      ],
168      "schemaVersion": 26,
169      "style": "dark",
170      "tags": [],
171      "templating": {
172        "list": []
173      },
174      "time": {
175        "from": "now-6h",
176        "to": "now"
177      },
178      "timepicker": {},
179      "timezone": "",
180      "title": "sample",
181      "uid": "UpBk6EfGz",
182      "version": 1
183---
184apiVersion: apps/v1
185kind: Deployment
186metadata:
187  name: grafana-deployment
188  namespace: monitoring
189  labels:
190    app: grafana-server
191spec:
192  replicas: 1
193  selector:
194    matchLabels:
195      app: grafana-server
196  template:
197    metadata:
198      labels:
199        app: grafana-server
200    spec:
201      containers:
202        - name: grafana
203          image: grafana/grafana:latest
204          # args:
205          #  - "--config=/etc/config/datasources/datasources.yml"
206          ports:
207            - containerPort: 3000
208          volumeMounts:
209            - name: datasources-config-vol
210              mountPath: /etc/grafana/provisioning/datasources
211            - name: dashboards-config-vol
212              mountPath: /etc/grafana/provisioning/dashboards
213            - name: dashboards-settings-vol
214              mountPath: /var/lib/grafana/dashboards
215      volumes:
216        - name: datasources-config-vol
217          configMap:
218            name: grafana-datasources-conf
219        - name: dashboards-config-vol
220          configMap:
221            name: grafana-dashboards-conf
222        - name: dashboards-settings-vol
223          configMap:
224            name: grafana-dashboards-settings
225---
226apiVersion: v1
227kind: Service
228metadata:
229  name: grafana-service
230spec:
231  selector:
232    app: grafana-server
233  type: NodePort
234  ports:
235    - port: 8100
236      targetPort: 3000
237      nodePort: 30020
applyする
最後に kubectl apply コマンドを実行し、コンテナを展開します。
1kubectl apply -f ${name of pushgateway k8s file}.yml -n monitoring
2kubectl apply -f ${name of prometheus k8s file}.yml -n monitoring
3kubectl apply -f ${name of grafana k8s file}.yml -n monitoring
Docker Desktopのダッシュボードを開き、無事deploymentコンテナが作成されていることを確認しましょう。
その後、ブラウザを開き、以下にてサービスの画面が表示されることを確認しましょう。
- Prometheus:
http://localhost:30000/ - grafana:
http://localhost:30020/
最後に
Kubernates 環境で Prometheus と Grafana と pushgateway を構築する設定を作成しました。 今回の作業範囲では Prometheus のストレージボリュームを外部にマウントしていないので、必要な人は適宜設定してください。